Screenshots

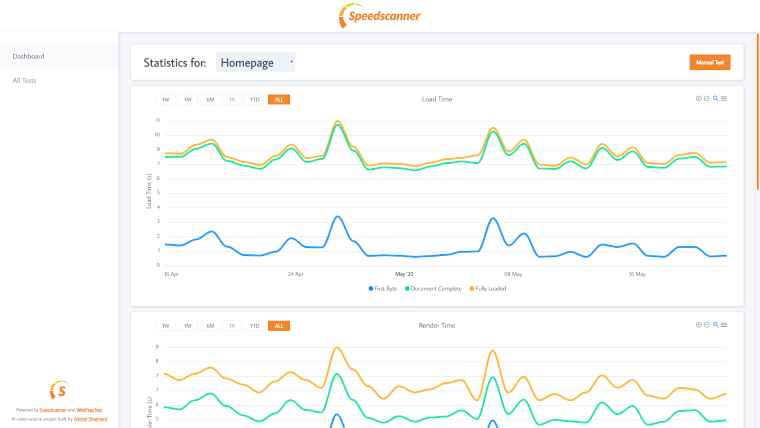
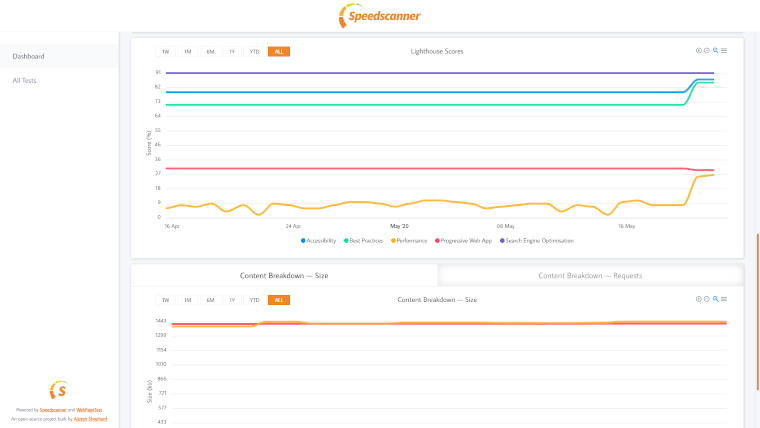
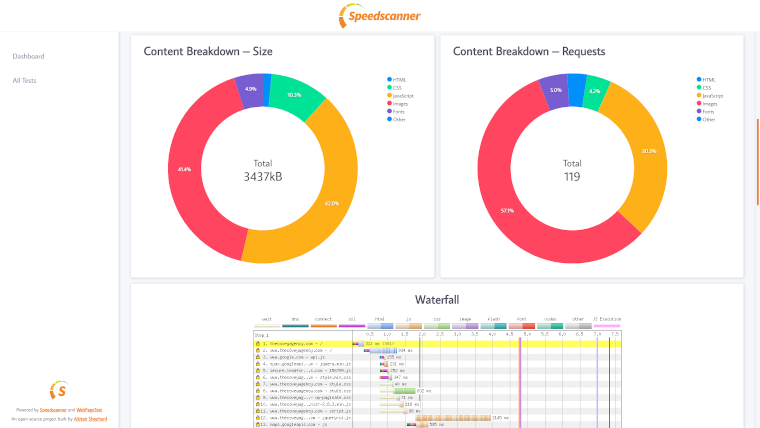
Dashboard of Speedscanner installation

Top of Speedscanner dashboard with graphs showing load and render time over time Bottom of Speedscanner dashboard with graphs showing lighthouse score and content breakdown over time

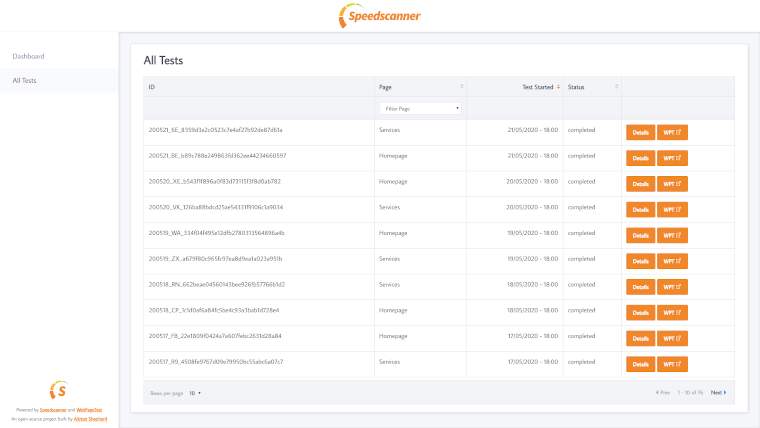
Sortable list of all tests recorded

Speedscanner All Tests page with a table showing a list of tests including etst ID, page, time started, status and links to a details page and the WebPageTest URL

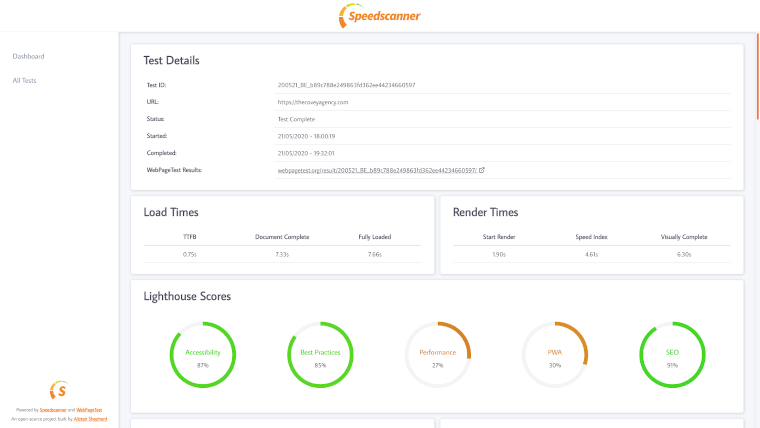
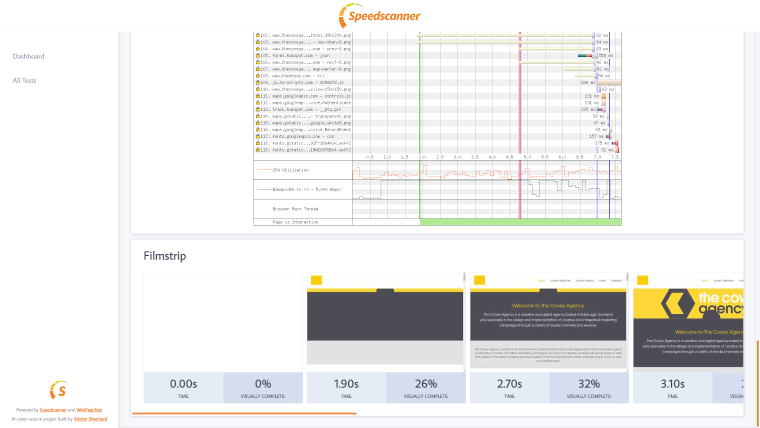
Individual views for each test

Top of a single test page showing test details, load and render times and lighthouse scores Part-way down single test page showing content breakdown pie charts and a segment of the WebPageTest waterfall Bottom of the single test page showing the end of the WebPageTest waterfall and a page filmstrip